ON THIS PAGE
Universal Analytics (GA3) is going away
Until July 1, 2023, you can continue to use and collect new data in your Universal Analytics properties. After July 1, 2023, you can still access the previously collected data for the next 6 months. Therefore, it is recommended to export the reports before the given time to ensure the availability of the data.
As you may know, Universal Analytics is a tool that is used daily to track and measure KPIs for any online business. It is free and user-friendly. However, there are some minor issues and suggestions for improvement that have been raised by businesses. The Google Analytics team has taken note of these suggestions and has developed a new version of Google Analytics that provides more accurate tracking.
Introduction of GA4
Google Analytics 4 (GA4) is the latest version of Google’s web analytics platform that provides advanced insights into website and app performance. GA4 is designed to offer a more comprehensive understanding of user behavior across different devices and platforms and to help businesses adapt to the changing privacy landscape. Unlike previous versions of Google Analytics, GA4 allows you to track website and app analytics on the same platform. We will explore what GA4 is, what makes it different from Universal Analytics, and how businesses can benefit from using it to track and optimize their online presence.
GA4 vs Universal Analytics
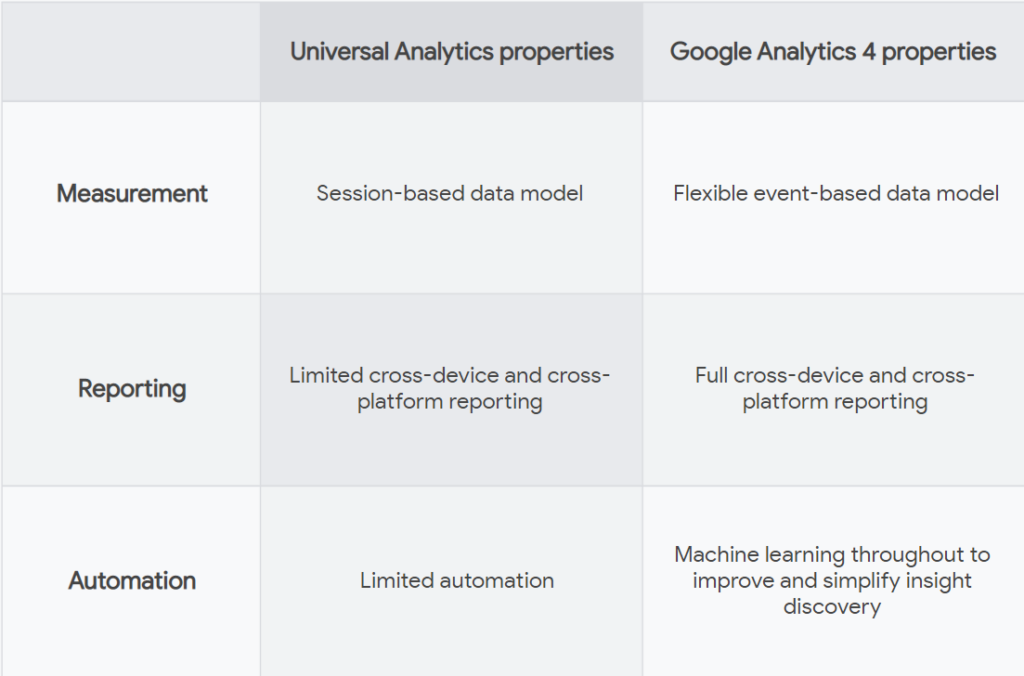
Image Source – Google Skillshop
Referring to the above image does not mean that we cannot track events in Universal Analytics. The foundation of Universal Analytics is based on tracking data using a session-based data model, whereas GA4 uses an event-based behavioral model to track data.
Cross platform tracking
GA4 cross-platform tracking allows you to track user interactions across multiple platforms such as websites, mobile apps, and even offline touchpoints. It enables you to gain a deeper understanding of your customers’ behavior by capturing their interactions with your brand from multiple touchpoints.
With GA4 cross-platform tracking, you can see how users interact with your brand across different devices and platforms. For example, if a user visits your website and later interacts with your mobile app, you can see a complete view of their journey across both touchpoints. This can help you better understand how your customers engage with your brand and optimize your marketing campaigns accordingly.
To enable GA4 cross-platform tracking, you need to set up a property in GA4 and implement the GA4 tracking code across all of your platforms, including websites, mobile apps, and offline touchpoints. Additionally, you can use Google Tag Manager to streamline the implementation process and make it easier to manage your tracking across multiple platforms. Overall, GA4 cross-platform tracking provides a comprehensive view of user behavior across all touchpoints, helping you to make data-driven decisions and improve your customer experience.
How to implement cross platform tracking
To achieve accurate cross-platform tracking, it is recommended to measure user activity across platforms using a User ID. User ID is a feature in Google Analytics that allows you to assign a unique ID to each user, enabling you to track their interactions across multiple devices and platforms. By using User-ID, you can accurately track user behavior and gain a deeper understanding of their journey across touchpoints.
When you implement User-ID, you can link a user’s activity across different platforms, such as their interactions with your website and mobile app. This enables you to see a complete view of their behavior and engagement with your brand. With User-ID, you can also see how often users switch between devices and platforms, and identify opportunities to improve the user experience.
To implement a User ID in Google Analytics, you need to create a unique User ID for each user and pass this ID to Google Analytics each time the user interacts with your brand. This requires some development work to ensure that the User ID is passed accurately and consistently across all touchpoints. However, the benefits of accurate cross-platform tracking make it worthwhile for businesses that want to gain a deeper understanding of their customer’s behavior and optimize their marketing campaigns accordingly.
GA4 – Navigation and Interface
Home
When you create and log into your Google Analytics 4 account, you will see a home page similar to the screenshot above that provides you with a snapshot of your website’s data. However, if you have just created a new account, it may take some time for data to start reflecting in your account. This is because Google Analytics needs time to process the data and make it available in your reports.
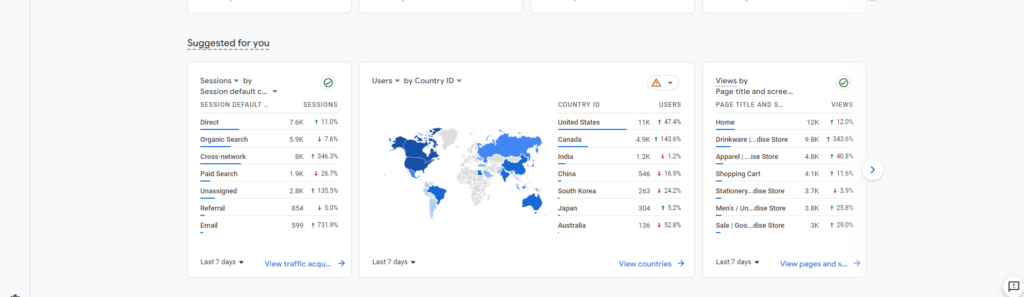
Additionally, as shown in the screenshot above, you can navigate to any section of the report to view detailed information about traffic sources, countries, top pages, and more. This allows you to drill down into specific metrics and dimensions to gain deeper insights into your website’s performance.
For example, you can view the sources of your website’s traffic, such as organic search, paid search, social media, and referral traffic, to understand which channels are driving the most visitors to your site. You can also view data by country or region to see where your website’s visitors are located and identify opportunities to expand your audience. Additionally, you can view reports on top pages to understand which pages on your website are receiving the most traffic and engagement.
By using the various sections of the report and drilling down into specific metrics and dimensions, you can gain a comprehensive understanding of your website’s performance and identify opportunities for improvement. This can help you optimize your marketing campaigns, improve your user experience, and ultimately drive more traffic and conversions to your website.
Insights is a new feature in Google Analytics that can provide valuable information and answers to your questions related to tracking data. This feature uses machine learning algorithms to analyze your data and identify trends, anomalies, and opportunities for improvement.
As shown in the screenshot above, Insights can provide answers to a variety of questions related to your website’s performance, such as:
- What is causing changes in traffic on my website?
- Which pages are driving the most engagement on my website?
- What are the top sources of traffic to my website?
- How does user behavior differ between new and returning visitors?
- Which products or services are driving the most revenue on my website?
By using Insights, you can gain a deeper understanding of your website’s performance and identify opportunities to optimize your marketing campaigns, improve your user experience, and drive more conversions. Additionally, Insights can provide automated alerts when significant changes or anomalies are detected in your data, allowing you to quickly take action and address any issues.
Reports
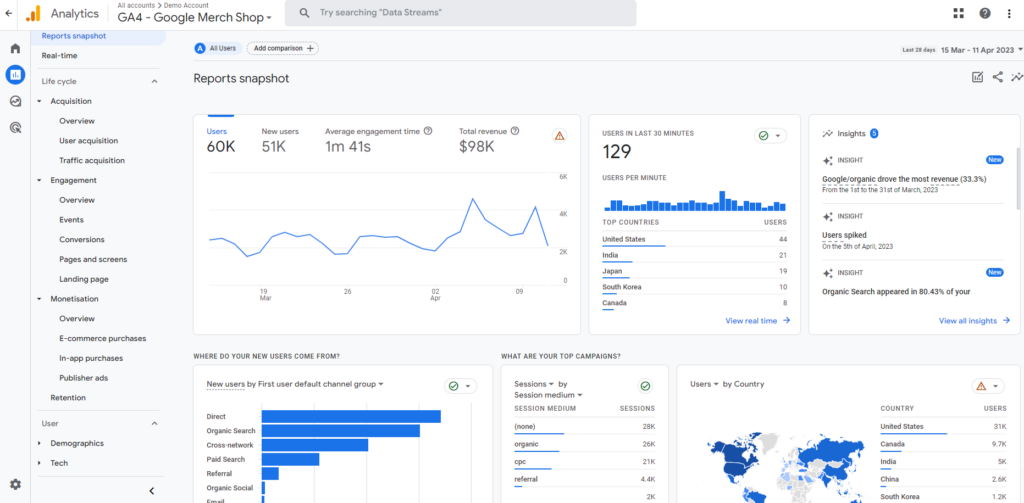
As shown in the screenshot above, the Reports section in Google Analytics 4 contains a variety of sections to help you analyze your website’s performance:
- Acquisition: This segment provides information about how users are finding and accessing your website, including metrics such as traffic sources, and channel traffic reporting.
- Engagement: This segment provides information about how users are engaging with your website, including metrics such as page views, session duration, bounce rate, and events.
- Monetization: This segment provides information about how your website is generating revenue, including metrics such as ecommerce transactions, product performance, and revenue.
- Demographics: This segment provides information about the demographic characteristics of your website’s users, including metrics such as age, gender, and interests.
- Technology: This segment provides information about the technology and devices that your website’s users are using, including metrics such as the browser and operating system, device type, and network.
By using the Reports section and analyzing the data in each of these sections, you can gain valuable insights into your website’s performance and identify opportunities to improve your marketing strategies, user experience, and revenue generation.
Explore
The Explore section in Google Analytics 4 provides a powerful set of tools for data exploration and analysis. Here it allows you to create custom reports and visualizations them using a variety of data analysis techniques.
- Free-form exploration
- Funnel analysis
- Path analysis
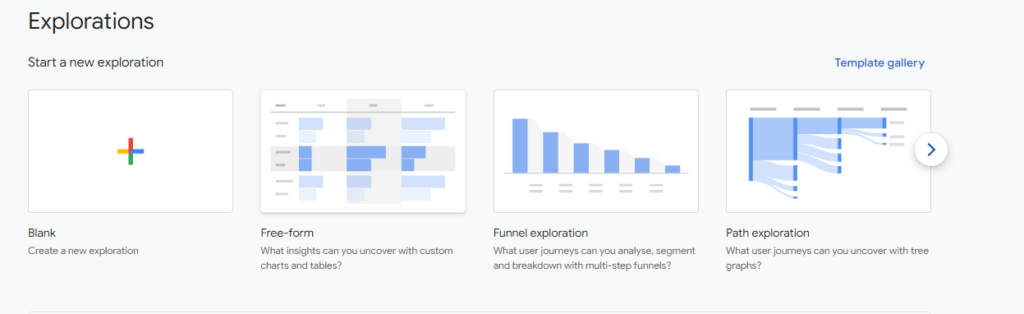
Free-form Exploration
You can create a custom data table by selecting the metrics and dimensions that are most relevant to your business goals. With help you to focus on specific data points that are most important to your website’s performance.
Funnel analysis
The custom report allows you to analyze the steps that users take when completing a specific action on your website, such as making a purchase or signing up for a newsletter. This can help you identify which steps in the process are most effective at driving conversion and which steps may be causing users to drop off or abandon the process.
Also read- Shopify Analytics: A Definitive Guide [Tools + FAQs]
Path analysis
Path analysis allows you to analyze the paths that users take as they navigate through your website. This can help you identify which pages are most commonly visited and which paths are most likely to lead to conversion, allowing you to optimize your website’s navigation and content to improve engagement and conversion rates.
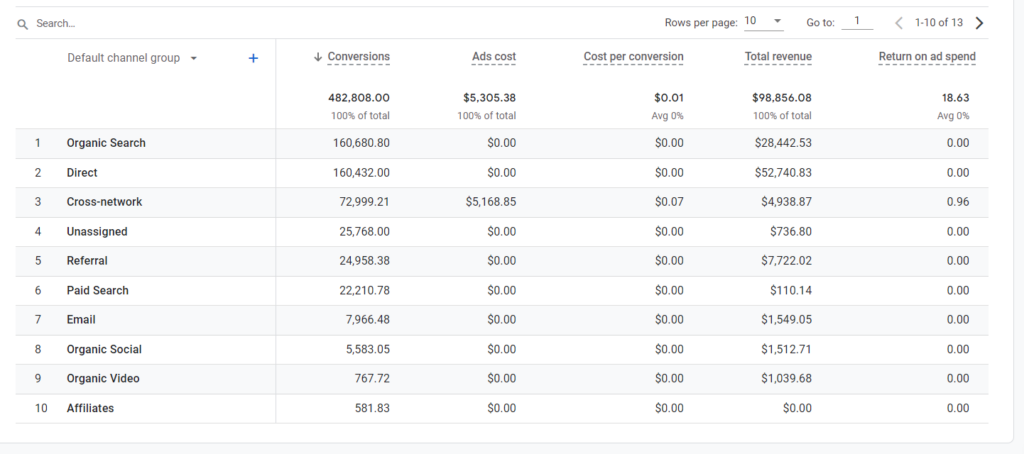
Advertising
The Advertising snapshot helps you better understand customer journeys and conversion performance. The reports help to answer your questions about how the conversion happened.
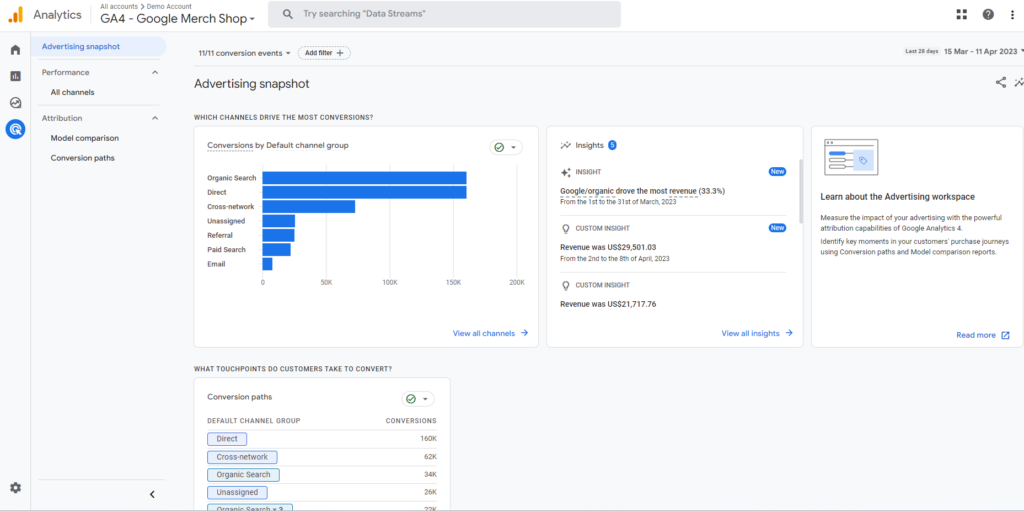
If you connect your analytics account with your ads account, you can able to view the return on ads. It provides the channel report with cost of spending on those channels.
To wrap up
This article provides information about GA4 and explains why the Google Analytics team is moving from GA3 to GA4. It also explores how businesses can effectively use GA4 to track their goals. Specifically, GA4 offers extensive tracking of eCommerce metrics such as transaction and visitor behavior tracking for both signed-in users and visitors.