

Ask five people in a distribution company running Epicor Prophet 21 (P21) what “this month’s sales” means. You may get five different SQL queries, all technically correct, all pulling from the same database, and all producing different numbers.
This isn’t a P21 defect. It’s a predictable consequence of how P21’s data model separates order capture, fulfillment, invoicing, and financial posting into distinct tables and timelines, and how reporting tools (Report Writer, Crystal Reports, SSRS, custom SQL, Excel exports) each sit at different points in that pipeline.
To actually resolve, not just paper over, reporting discrepancies, you need to understand what’s happening underneath the report: which tables are involved, which fields drive the numbers, and where P21’s own architecture creates legitimate room for two “correct” reports to disagree.
ON THIS PAGE
The Data Model Behind the Discrepancy
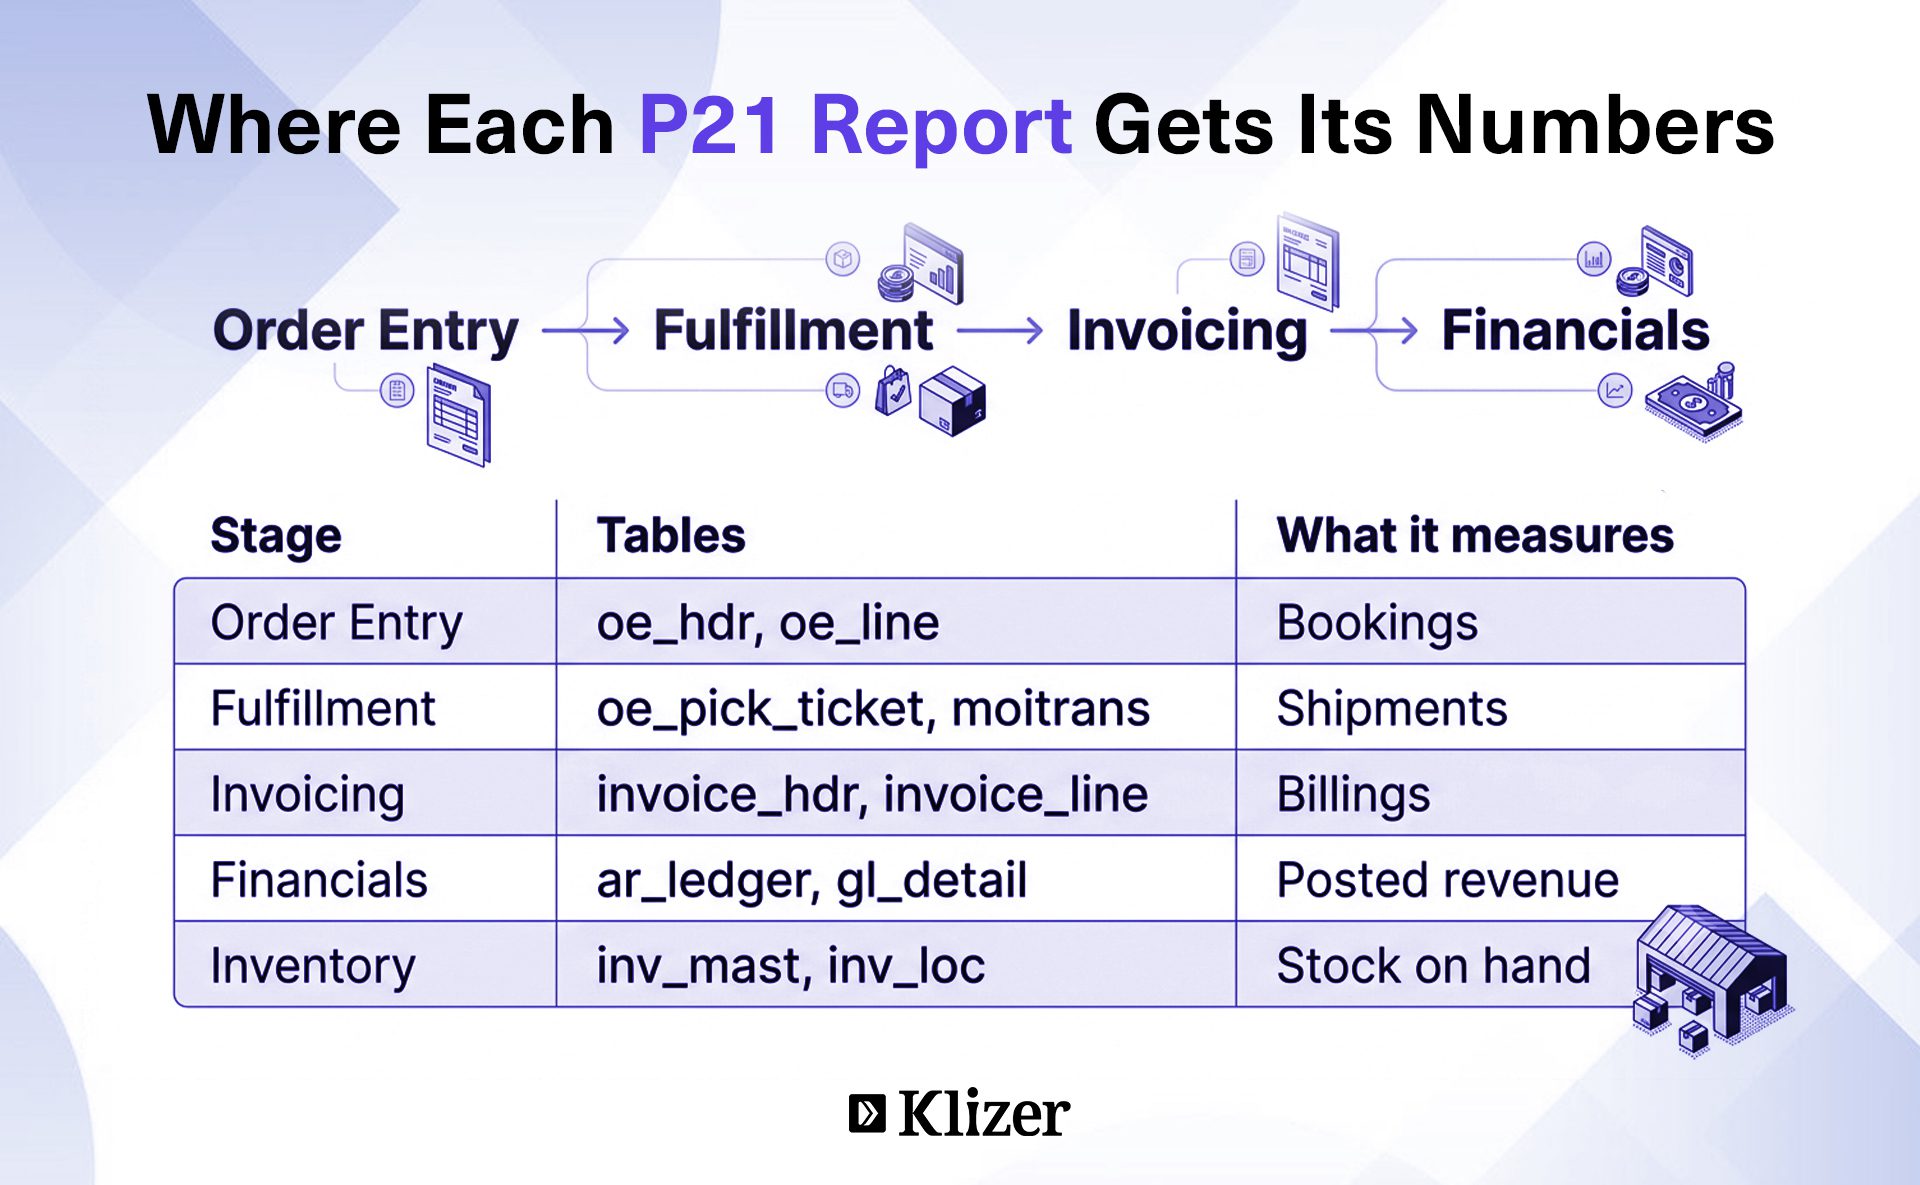
P21’s order-to-cash flow moves through several distinct table groups, and most Prophet 21 reporting mismatches trace back to which stage of this flow a given report is reading from:
| Stage | Primary Tables | What It Represents |
| Order Entry | oe_hdr, oe_line | The order as entered, before anything ships |
| Fulfillment | oe_pick_ticket, oe_pick_ticket_line, moitrans | Picking, packing, and inventory movement |
| Invoicing | invoice_hdr, invoice_line | What was actually billed to the customer |
| Financials | ar_ledger, gl_detail, gl_period_balances | What hit the subledger and general ledger |
| Inventory | inv_mast, inv_loc, moitrans | Item master data and location-level quantities |
A single order can spawn multiple invoices (partial shipments), and an invoice line traces back to an order line through source_type and source_id keys rather than a simple 1:1 relationship. A report built against oe_line (bookings) will never tie out perfectly to a report built against invoice_line (billings); they are measuring different events in the same transaction’s life, by design.
On top of the raw tables, P21 exposes a semantic layer of SQL views under the p21_view_* namespace (p21_view_oe_line, p21_view_invoice_hdr, p21_view_inv_mast, etc.). Epicor maintains these views specifically so that custom reports don’t break when the underlying schema changes between versions. Reports built directly against raw tables instead of these views are one of the most common sources of “the report used to work” complaints after an upgrade.
Root Causes, In Technical Detail
1. Which Date Field Is Actually Being Filtered
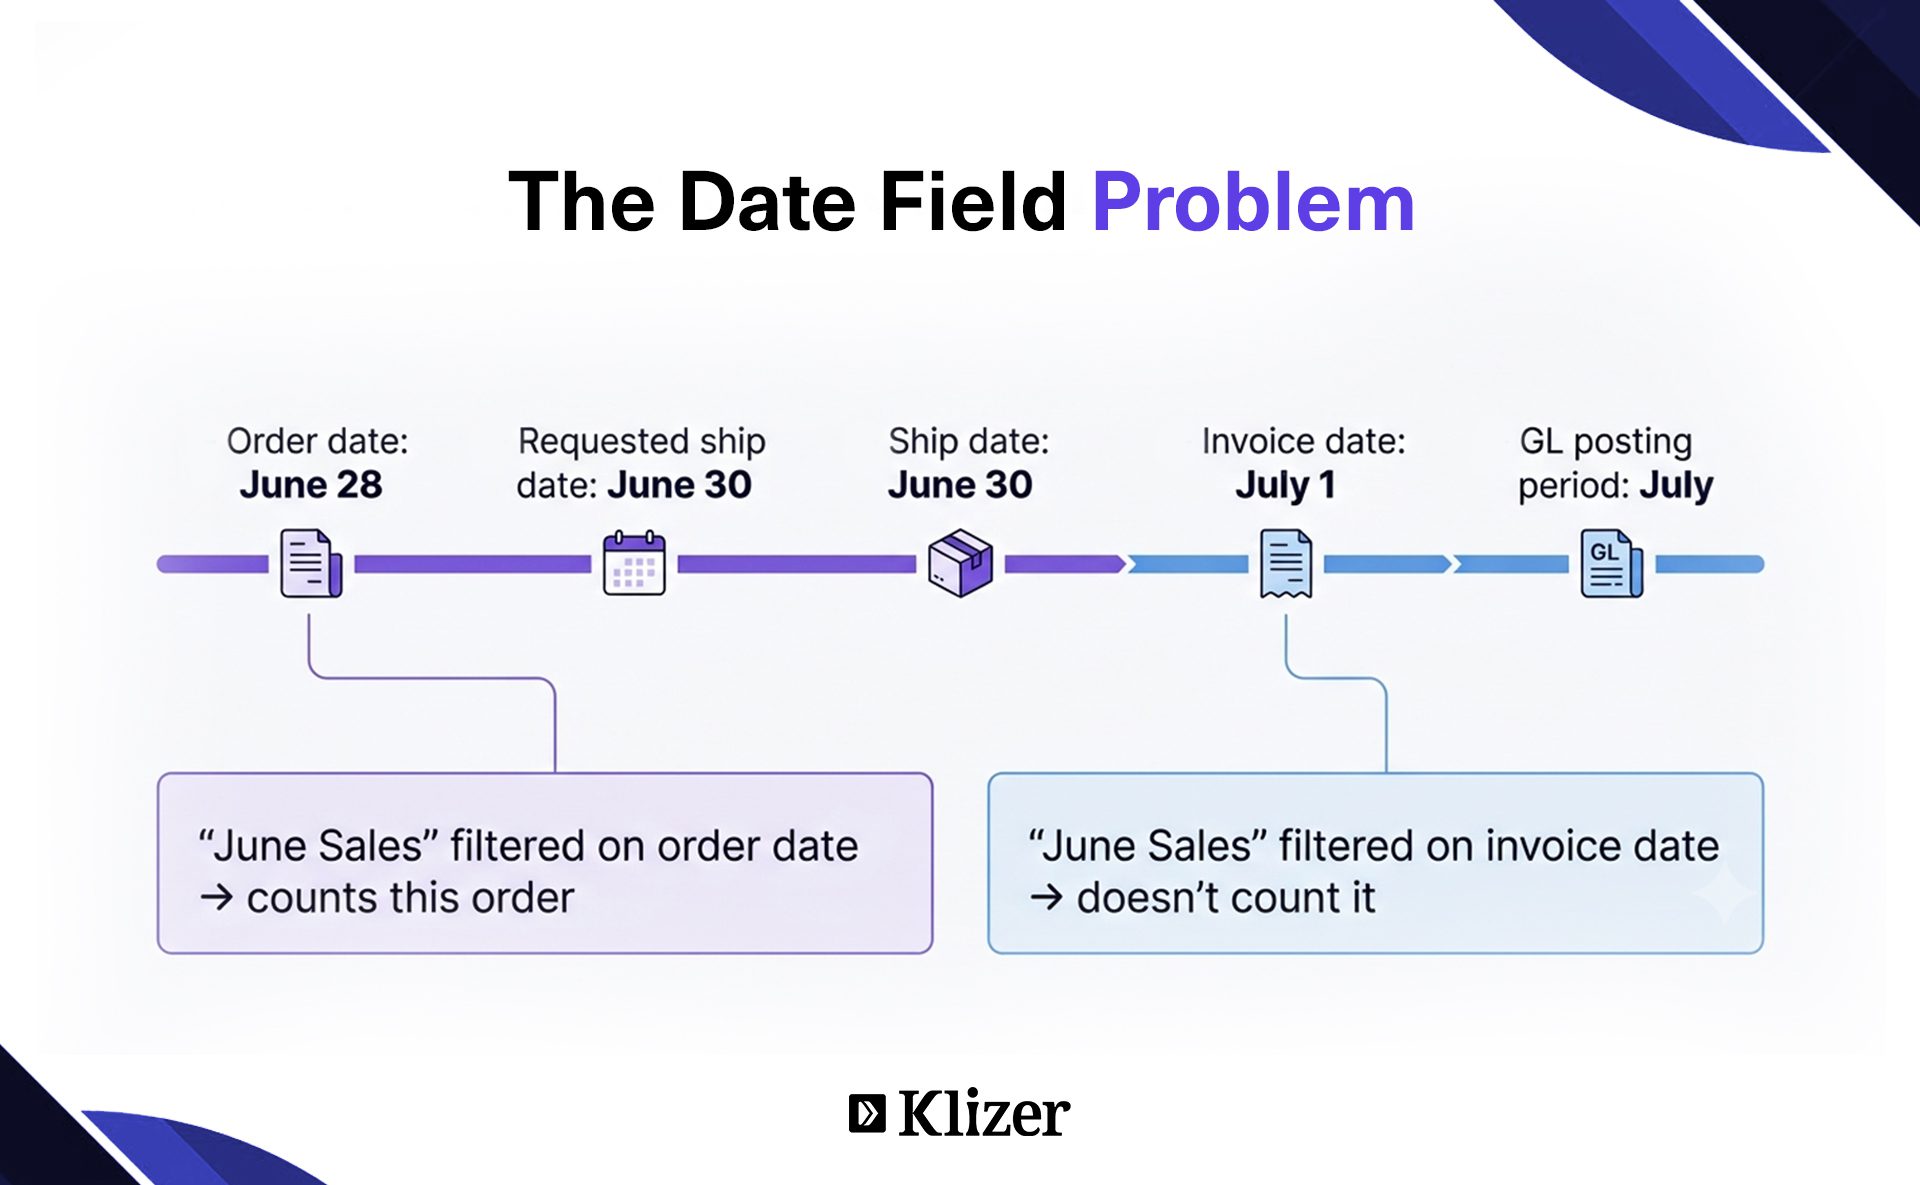
P21 carries several distinct date fields that can each define “when” a transaction happened:
- oe_hdr.order_date, when the order was entered
- oe_line.need_by_date / oe_line.req_ship_date, when the customer wants it
- oe_line.ship_date (via pick ticket completion), when it actually shipped
- invoice_hdr.invoice_date, when it was billed
- gl_detail.period / GL posting date, when it hit the ledger, which can lag the invoice date if the accounting period was held open or closed late
A report titled “June Sales” that filters on order_date and one that filters on invoice_date can each be completely correct and still disagree by tens of thousands of dollars, because an order entered June 28 and invoiced July 1 belongs to June in one report and July in the other.
What to check: open the report definition (Report Writer field list, Crystal Reports field mapping, or the SQL WHERE clause) and confirm which literal date column is being filtered, not what the report’s title says.
Read More: Common Prophet 21 API Integration Mistakes and How to Avoid Them
2. Header-to-Line Joins That Multiply Rows
oe_hdr is one row per order. oe_line is one row per line item. A naive join between them, or between invoice_hdr and invoice_line, turns “one order” into “N rows,” and if a report sums an order-level field (like an oe_hdr total) once per line instead of once per order, totals get inflated by a multiple of the average line count.
This is worse when a report also joins in oe_pick_ticket_line or moitrans for fulfillment detail, because a single order line can generate multiple inventory transactions (partial picks, backorder releases, warehouse transfers), multiplying rows again.
What to check: row counts at each join step, and whether monetary or quantity totals are being pulled from the header table (correct) or repeated per detail row and re-summed (incorrect).
3. Unit of Measure Conversion Errors
inv_mast stores a stocking unit of measure separately from the selling/pricing unit of measure used on oe_line. If a custom report sums qty_shipped directly without applying the UOM conversion factor stored in the item’s UOM table, a report can be off by whatever the conversion factor is; a classic case being cases vs. eaches, where a report can appear to under- or overstate volume by 12x, 24x, or whatever the case pack size is.
This shows up consistently in ecommerce integrations (Magento, BigCommerce, and similar platforms) where the storefront submits quantities in one UOM and P21 fulfills in another.
4. Costing Method Differences Driving Margin Discrepancies
P21 supports multiple costing approaches (average cost, standard cost, landed cost with additional cost components). A margin report built from inv_mast average cost can disagree with a report built from actual moitrans cost layers, and both can disagree with a GL-based margin calculated from gl_detail postings if landed costs (freight, duty) were allocated after the original transaction was posted.
What to check: which cost field the report references, inv_mast.average_cost, a specific moitrans cost layer, or a GL account balance, and whether landed cost allocations post in the same period as the original sale.
5. Warehouse Scope and In-Transit Inventory
inv_loc tracks quantity on hand, allocated, and on order per item, per warehouse (location_id). A report scoped to a single warehouse will legitimately show less inventory than a company-wide report. Still, the more subtle issue is inventory in transit between warehouses via internal transfer orders. Transferred stock that has left the source warehouse but hasn’t been received at the destination can appear in neither location’s “on hand” total, creating apparent inventory that doesn’t reconcile to the sum of individual warehouse reports.
Also relevant: “on hand” vs. “available to sell” (on hand minus allocated minus on hold) are different numbers, and reports that don’t clearly label which one they’re showing generate constant confusion between operations and sales.
6. Customer Hierarchy: Sold-To, Ship-To, and Bill-To
P21’s customer structure distinguishes sold-to, ship-to, and bill-to records, and a single commercial customer can have many ship-to customer_id records underneath one bill-to parent. A “customer count” report can mean the count of bill-to parents or the count of all ship-to records, producing very different totals. This directly affects the classic “customer active in one report, inactive in another” symptom: a ship-to location can be inactive while its parent bill-to is active, or vice versa.
7. Credit Memos, RMAs, and Negative Invoices
Credit memos and RMA-driven credits post as negative or reversing entries in invoice_hdr/invoice_line. A revenue report that filters out negative invoice amounts (intentionally, to simplify a “gross sales” view) will not tie to a GL-based net revenue figure that includes those reversals. Neither number is wrong, they answer “gross” vs. “net”, but only if the report clearly says which one it is.
Further Root Causes
- Cancelled and voided orders: A cancelled order line in oe_line typically remains in the table with its quantity or status flag adjusted rather than being deleted. A raw SELECT COUNT(*) against oe_line without filtering on completion/cancellation status will include cancelled lines that a properly filtered report excludes.
- Personal report filters in Report Writer: P21’s Report Writer allows saved, user-specific filter templates. Two users running the same-named report can be running different saved filter sets; one might have a saved warehouse filter or date-range default from months ago that the other doesn’t. This is invisible because the report name on screen looks the same to both users.
- GL close timing vs. transactional reporting: Finance often reports off gl_detail/gl_period_balances, which reflect the accounting period a transaction was posted to, not necessarily the transaction date. If a period was held open for adjustments, a GL-based revenue report for “June” can differ from an operationally dated report for “June” even when both are individually accurate.
- Custom SQL against raw tables instead of p21_view_*:Custom reports written directly against base tables instead of Epicor’s supported p21_view_* layers are exposed to schema changes during version upgrades. The report doesn’t error out; it silently returns different results because a join key, column name, or default filter changed underneath it.
- Scheduled snapshots vs. live queries: Reports delivered via scheduled SSRS subscriptions, exported dashboard snapshots, or cached BI extracts reflect the data as of their last refresh, not the current moment. Every scheduled report should carry a visible “data as of” timestamp.
How to Reconcile Two P21 Reports (Technical Walkthrough)
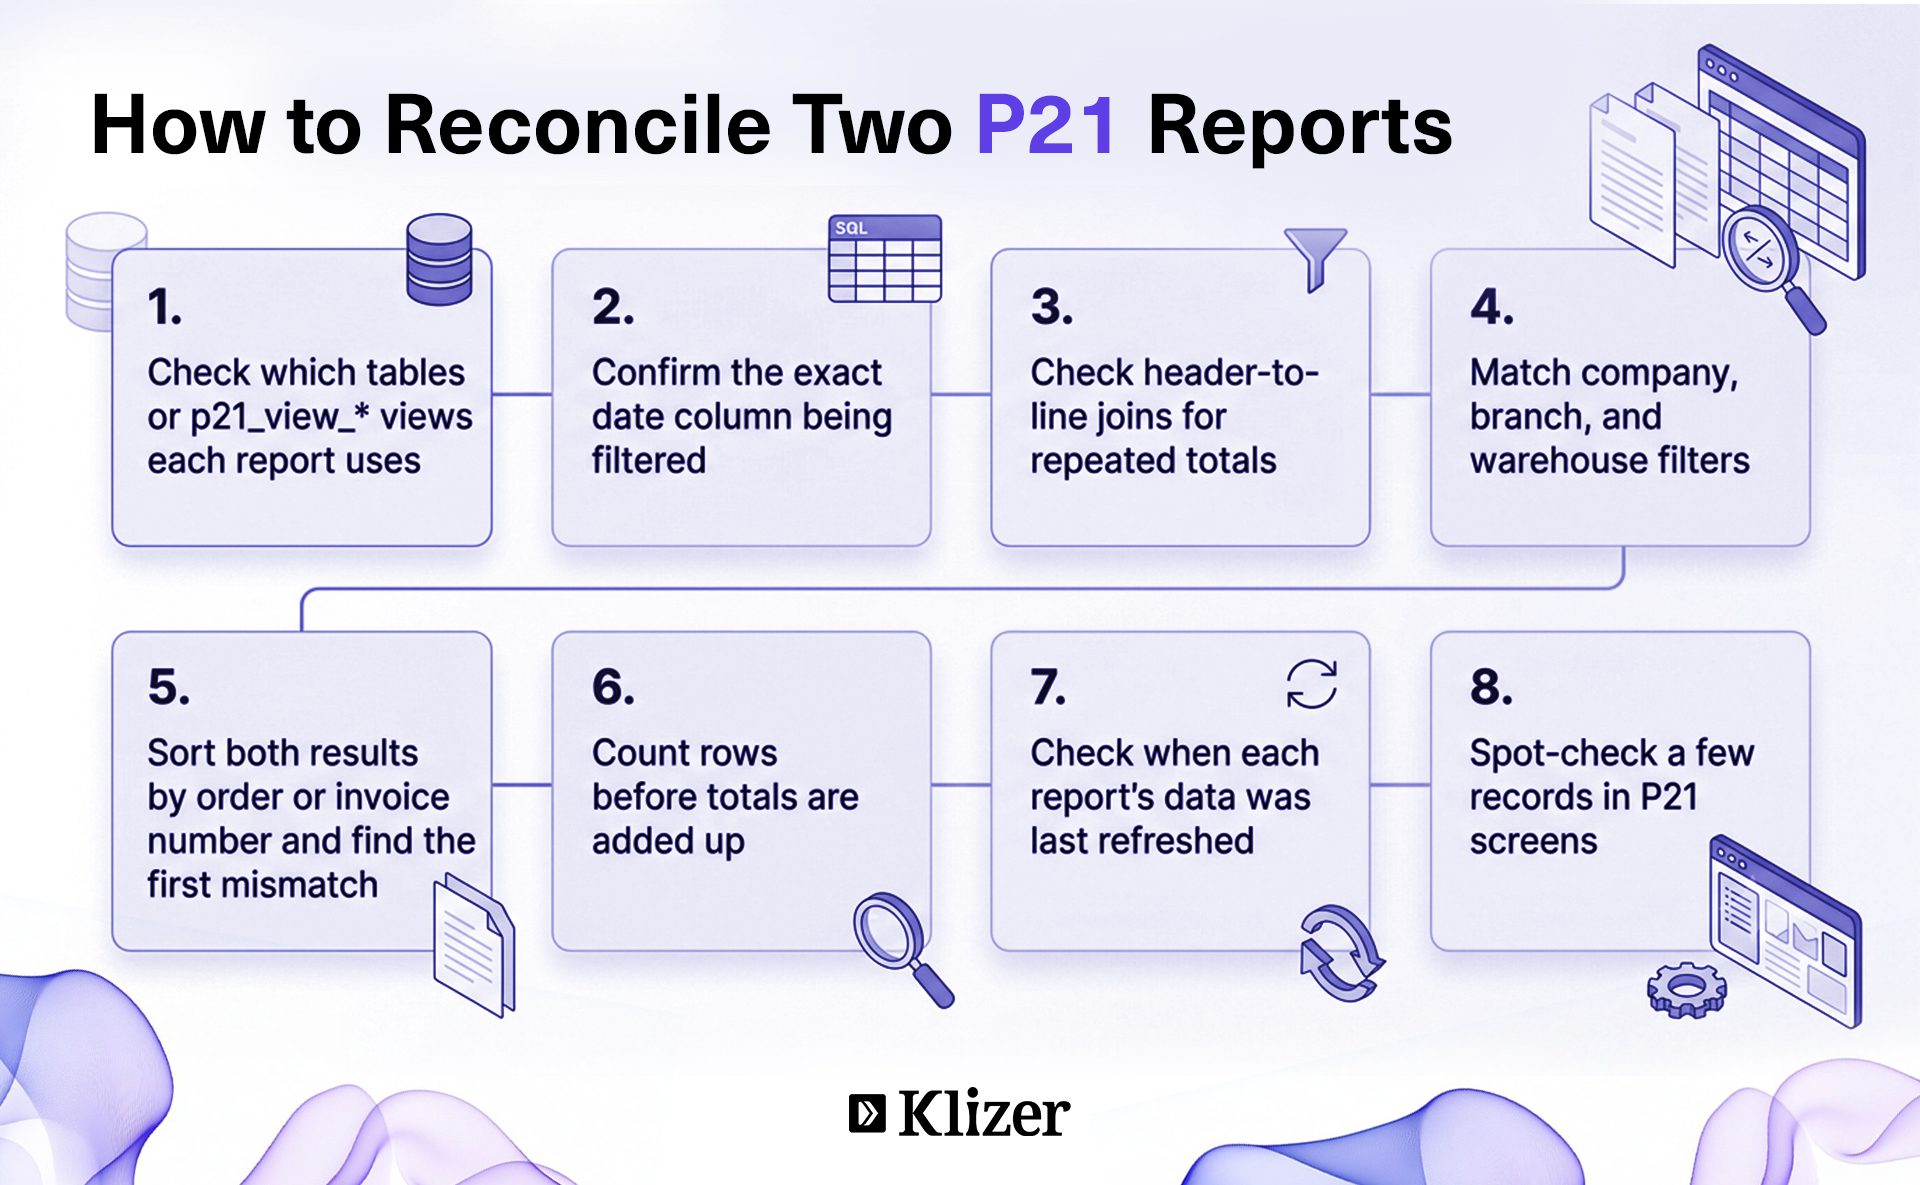
Step 1: Identify the tables and views each report queries.
Pull the actual SQL, Report Writer field list, or Crystal Reports data model. Note whether it hits p21_view_* views or raw tables.
Step 2: Identify the date field.
Confirm the literal column (order_date, ship_date, invoice_date, GL posting period), not the report title.
Step 3: Identify the join structure.
Map header-to-line relationships and confirm totals are pulled once per order/invoice, not repeated per detail row.
Step 4: Identify scope filters.
Company, branch, warehouse (location_id), customer class, product line, sales rep, confirm both reports use identical scope, or document the intended difference.
Step 5: Reconcile at the record level.
Pull the two result sets, sort by a common key (order number, invoice number), and find the first row where they diverge. This single divergent record almost always reveals the root cause faster than comparing aggregate totals.
Read More: SQL Server Best Practices for Prophet 21
Step 6: Check for duplication.
Row-count the base query before aggregation to catch join-driven multiplication.
Step 7: Confirm the refresh timestamp.
Make sure both reports represent the same data snapshot, especially if one comes from a live query and the other from a scheduled extract.
Step 8: Validate against source.
Spot-check a handful of records directly in P21 screens (Order Entry, Invoice inquiry, Item Availability) against both reports.
A Practical Reporting Governance Model for P21
| Governance Element | What “Done Well” Looks Like in P21 |
| KPI Definition | Written definition tied to specific fields (e.g., “Revenue = invoice_hdr.invoice_date within period, excludes credit memos”) |
| Data Source | Documented as a p21_view_* view name or specific raw table, not just “P21” |
| Date Logic | Explicit column reference, not a description |
| Filters | Company/branch/warehouse scope documented and defaulted consistently across users |
| Calculations | UOM conversions and costing method explicitly stated |
| Ownership | A named report owner responsible for validating after upgrades |
| Refresh | Visible “data as of” timestamp on every scheduled report |
| Testing | Row-count and record-level validation built into the upgrade checklist |
| Change Control | Report modifications tracked like code changes |
| Security | Access to sensitive fields (cost, margin) controlled at the report/view level |
Questions Every P21 Report Should Answer
- Which table or p21_view_* view is this built on?
- Which literal date column defines the reporting period?
- Is the total pulled from a header record or re-summed across joined detail rows?
- What UOM and costing assumptions are baked into the numbers?
- Which company, branch, and warehouse scope applies?
- Are cancelled orders, credit memos, and RMAs included or excluded?
- Is this a live query or a scheduled/cached snapshot, and as of when?
- Does this report use a personal saved filter that could differ from a colleague’s?
- Has this report been validated since the last P21 upgrade?
- Who owns this report and can explain how its numbers are produced?
If nobody in the organization can answer these questions for a given report, the issue isn’t a broken report; it’s a missing reporting governance process.
Final Thoughts
Reporting discrepancies in Prophet 21 are rarely a database error. They’re the visible symptom of P21’s real architecture: separate tables for orders, fulfillment, invoicing, and GL postings; a supported p21_view_* semantic layer that custom reports should, but don’t always, use; UOM and costing logic that must be applied consistently; and personal, scheduled, and cached report variants that can each be “correct” for a different moment or definition.
The fix isn’t another report. It’s tracing each existing report back to its literal fields, joins, and filters, documenting what it actually measures, and standardizing the handful of KPI definitions that matter most so that when two reports are supposed to answer the same question, they’re built to do so.
If your Prophet 21 reporting environment is feeding an ecommerce integration on Adobe Commerce, Magento, Shopify Plus, Shopware, or BigCommerce, the same data quality issues that cause internal report discrepancies will surface as pricing errors, inventory mismatches, and order failures in the storefront. Klizer builds and maintains the integration layer between P21 and your ecommerce platform. Book a consultation to review where your data pipeline is exposed.